

Generation and yield
Solar Generation and Yield Estimation Software
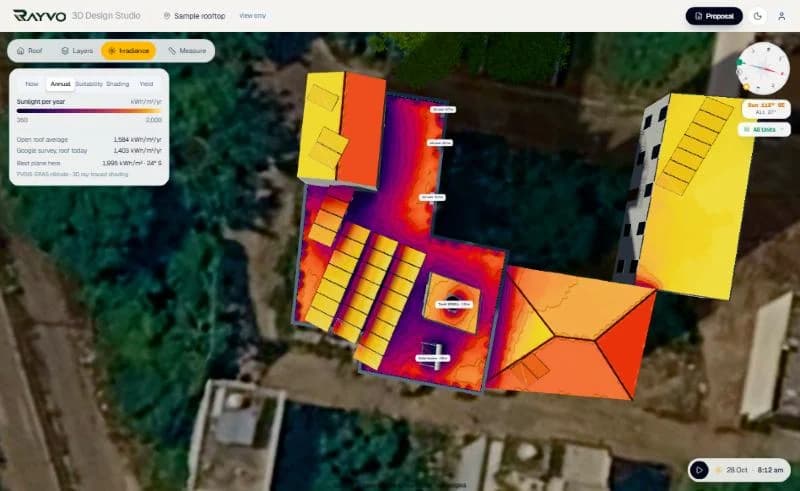
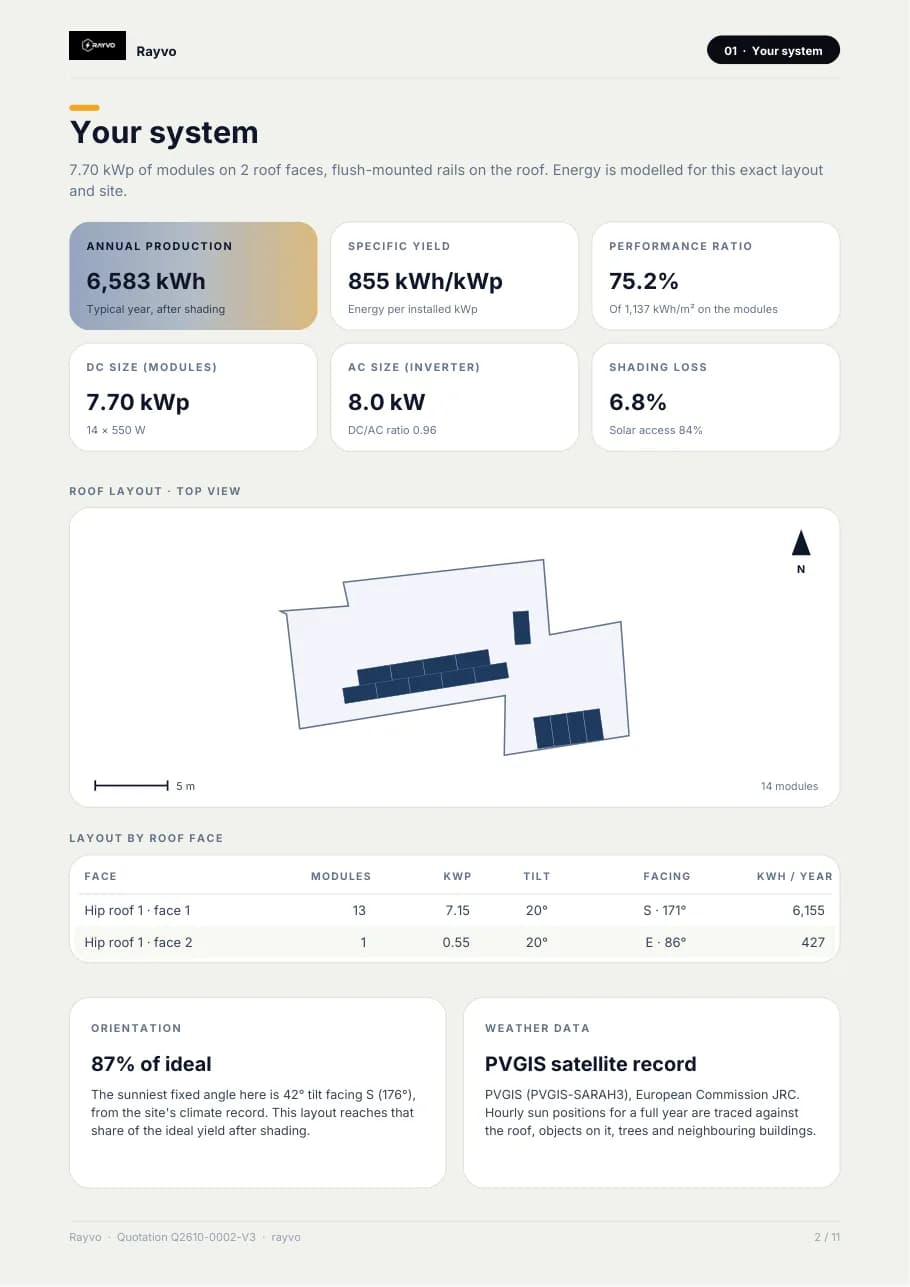
RAYVO estimates how much a rooftop system will generate from the site's climate record, the tilt and facing of every table, and the shading from the 3D model. The figures appear as annual and monthly production, yield per kWp and performance ratio, and they drive the savings, payback and proposal.
What it does, how, and what you get
Each capability below says what it does, how it is worked out, what it produces and why it matters to installers and EPC companies.
Climate data for the address
- What it does
- Sunlight at the site, month by month.
- How it works
- PVGIS climate records for the location: monthly global and diffuse irradiation, and yield modelled for each orientation when the service is reachable, otherwise an estimate that is marked as one.
- What you get
- The radiation database used, printed in the proposal.
- Why it matters
- A generation figure is only as credible as the weather behind it.
Every table in its own plane
- What it does
- Generation per roof face and table.
- How it works
- Each table's tilt and facing are used, so an east-west roof, a south terrace and a pitched wing are each counted on their own plane.
- What you get
- Yearly energy by roof face in the proposal's layout table.
- Why it matters
- Mixed roofs are normal; one average tilt would mislead.
Shading applied
- What it does
- Energy after shade.
- How it works
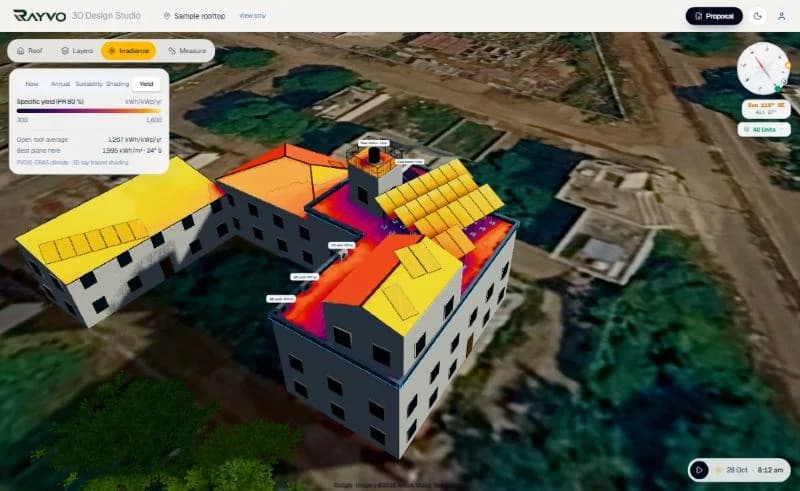
- The year-round shading from the 3D scene is applied per table and per month.
- What you get
- Annual production after shading, shading loss and solar access.
- Why it matters
- The customer is shown what the roof will really produce, not a clear-sky figure.
Optimal tilt and facing
- What it does
- The orientation that collects the most energy at the site.
- How it works
- Measured from PVGIS when reachable; otherwise a latitude fit (tilt ≈ 0.76 × latitude + 3.1°) facing the equator, flagged as an estimate.
- What you get
- The ideal angle, and how close the layout is to it.
- Why it matters
- A fixed tilt-equals-latitude rule is wrong both ways: monsoon India wants steeper, cloudy northern Europe shallower.
Month-by-month production
- What it does
- Production for every month of the year.
- How it works
- Sun on the modules, energy, kWh per kWp, performance ratio and savings for each month.
- What you get
- A chart and table in the proposal.
- Why it matters
- Customers see the dip in the monsoon and the strong months before they sign.
Savings and payback
- What it does
- What the generation is worth.
- How it works
- Tariff, export credit, self-use share, tariff rise, yearly output loss, upkeep and inverter replacement over 25 years, with the PM Surya Ghar subsidy for Indian homes.
- What you get
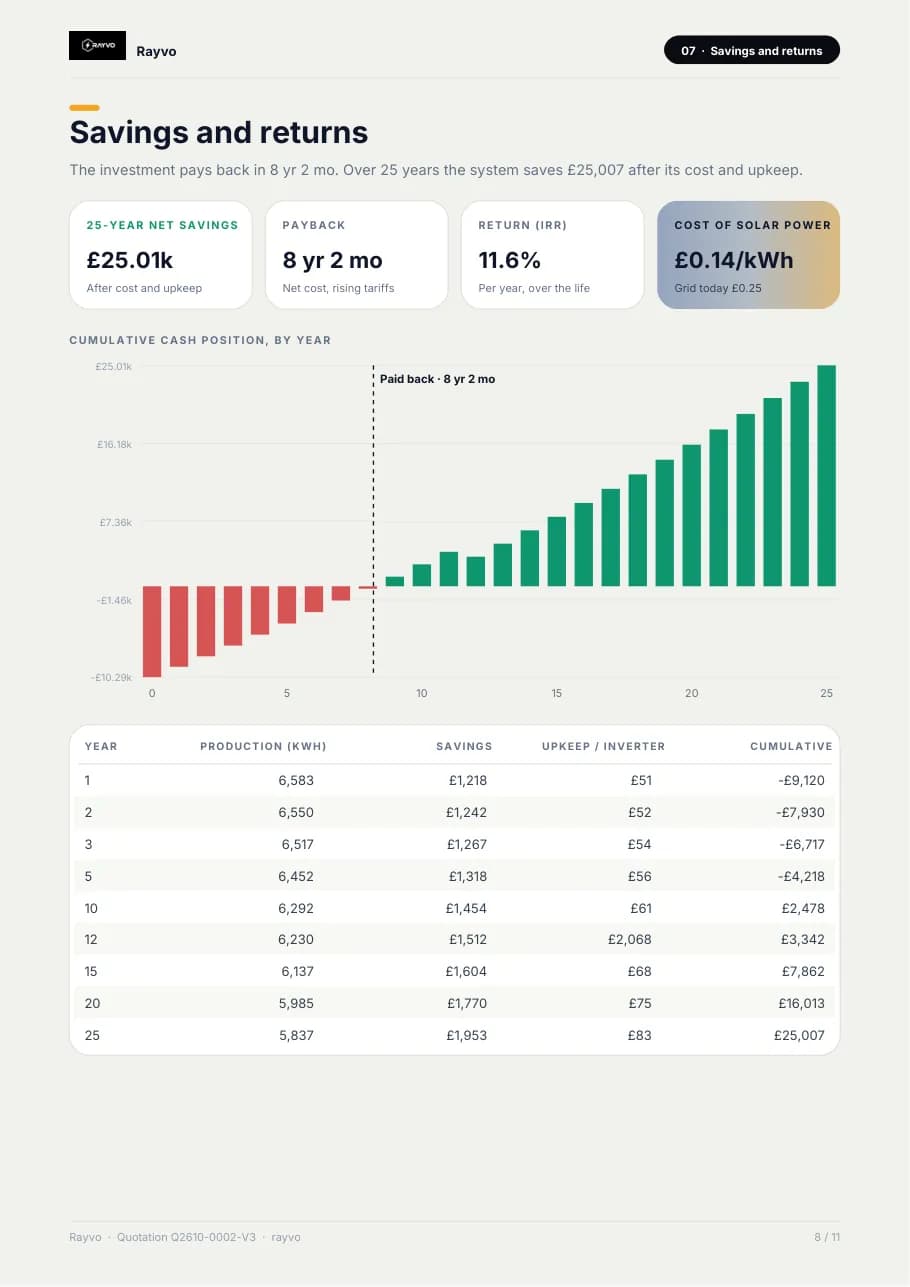
- Payback, 25-year savings, yearly return and cash position by year.
- Why it matters
- The generation figure becomes the number the customer decides on.
Quick estimates in the CRM
- What it does
- Units per day, month and year when quoting from a lead.
- How it works
- The state's sun hours and the engine's performance ratio give daily, monthly and yearly units; savings use the customer's own rate per unit from their bill.
- What you get
- A quick quotation that prints generation, savings and payback.
- Why it matters
- A salesperson can answer "how many units will I get?" on the first call.
What the outputs look like
Screens from the RAYVO 3D Design Studio, pages from its proposals, and sample drawings marked as illustrations.
Four steps on one design
- 1
Locate the site
Climate data for the exact address.
- 2
Lay out the tables
Tilt and facing of every table counted.
- 3
Apply shading
Month-by-month loss from the 3D scene.
- 4
Present it
Production, savings and payback in the proposal.
The methods behind the numbers
Design-stage figures from recognised methods. Final structural and electrical designs are signed by licensed engineers.
| Climate source | PVGIS monthly global and diffuse irradiation (ERA5 where available) |
|---|---|
| Per-table model | Each table's own tilt and azimuth |
| Shading | Applied per table and per month from the 3D scene |
| Optimal orientation | From PVGIS, or a latitude fit marked as an estimate |
| Outputs | Annual and monthly kWh, kWh per kWp, performance ratio, solar access |
| Financials | 25-year cash flow, payback, return, tariff rise, degradation, subsidy |
Solar Generation & Yield questions
From PVGIS climate records for the location. If the service cannot be reached, the studio falls back to an estimate and says so in the figures.
Yes. Shading from the 3D model is applied to each table, month by month, before the annual figure is shown.
Yes. The proposal shows monthly production, and a quick quotation from the CRM prints units per day, month and year with the savings at the customer's own rate per unit.
No. It is an estimate from climate records and the design. Real output varies with weather, dust, shading changes and maintenance.
More solar engineering in RAYVO
Ready to run your business smarter?
Bring your solar design, CRM, quotations, projects, finance and business operations together with RAYVO.
Or talk to us on WhatsApp at +91 90399 94090