

Shadow analysis
Solar Shadow Analysis Software for Rooftop Solar
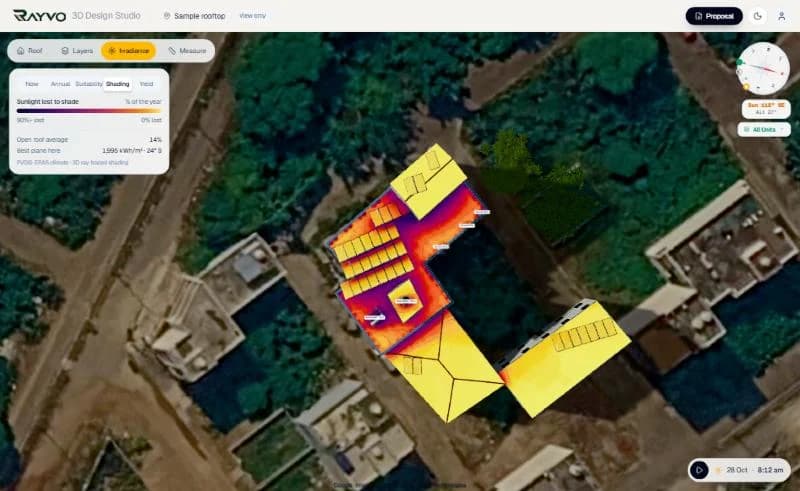
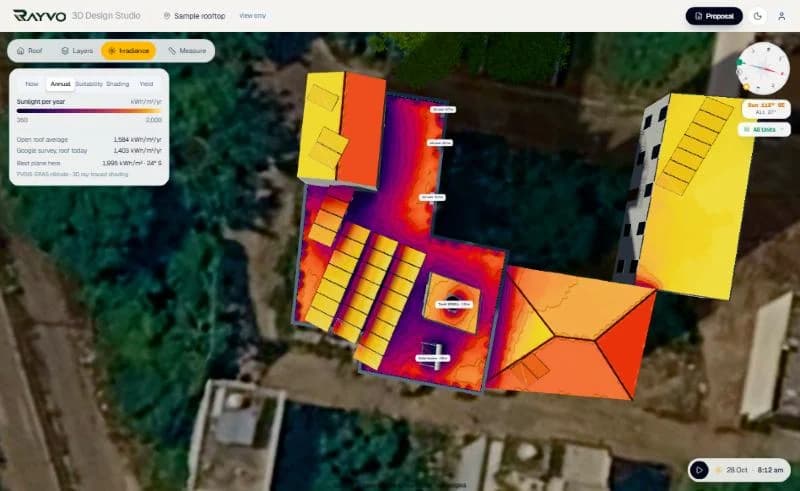
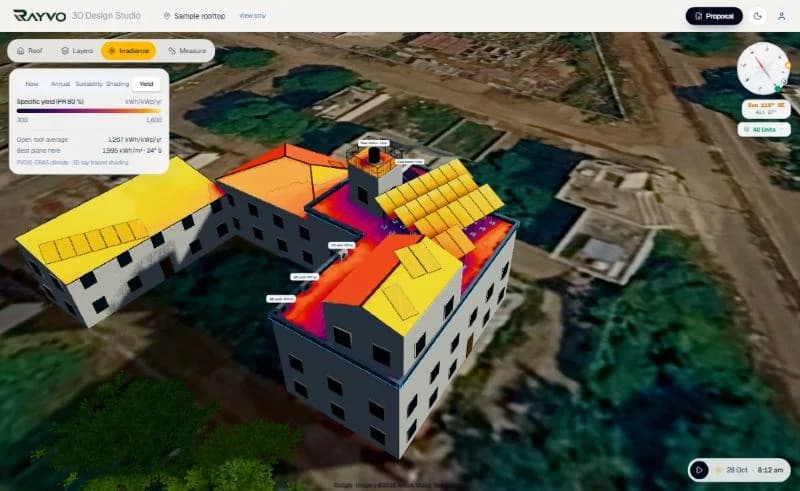
RAYVO works out shading from the 3D model of the site: the building, its parapets and storeys, water tanks and stair rooms, trees, neighbouring buildings and the other panel rows. The result is shading loss for every table, month by month, and heat maps that show where on the roof panels earn the most.
What it does, how, and what you get
Each capability below says what it does, how it is worked out, what it produces and why it matters to installers and EPC companies.
Year-round shading from the 3D scene
- What it does
- Shading loss for every module table across a full year.
- How it works
- The sun is swept across the 21st of every month in half-hour steps. At each position every module is ray-cast against buildings, storeys, parapets, objects, trees, neighbours and other rows, and the blocked share of clear-sky beam energy on that module's plane is added up month by month.
- What you get
- The share of yearly energy each table keeps, a value for each month, a module-weighted shading factor and solar access.
- Why it matters
- Winter shade from a parapet or tank is longest exactly when the sun is low; a single noon snapshot misses it.
Diffuse light counted honestly
- What it does
- Shade is applied to direct sunlight, not to the whole sky.
- How it works
- Each month's loss is the beam loss scaled by that month's beam share, taken from the diffuse fraction in the site's climate record. Clear winters count fully, cloudy monsoon months much less.
- What you get
- Monthly shading losses that follow the local climate.
- Why it matters
- Treating cloudy months like clear ones overstates shading in the monsoon and understates it in winter.
Five roof heat maps
- What it does
- Colours every point of every roof by sunlight.
- How it works
- PVGIS monthly global and diffuse irradiation is transposed onto each surface with the Hay-Davies sky model, counting only sun positions and sky the point can actually see.
- What you get
- Now (W/m²), Annual (kWh/m² per year), Suitability, Shading (% of the year lost) and Yield (kWh/kWp per year).
- Why it matters
- The installer sees at a glance which roof faces and corners are worth panels before placing a single table.
Sun path over the house
- What it does
- The real path of the sun for any day at the site.
- How it works
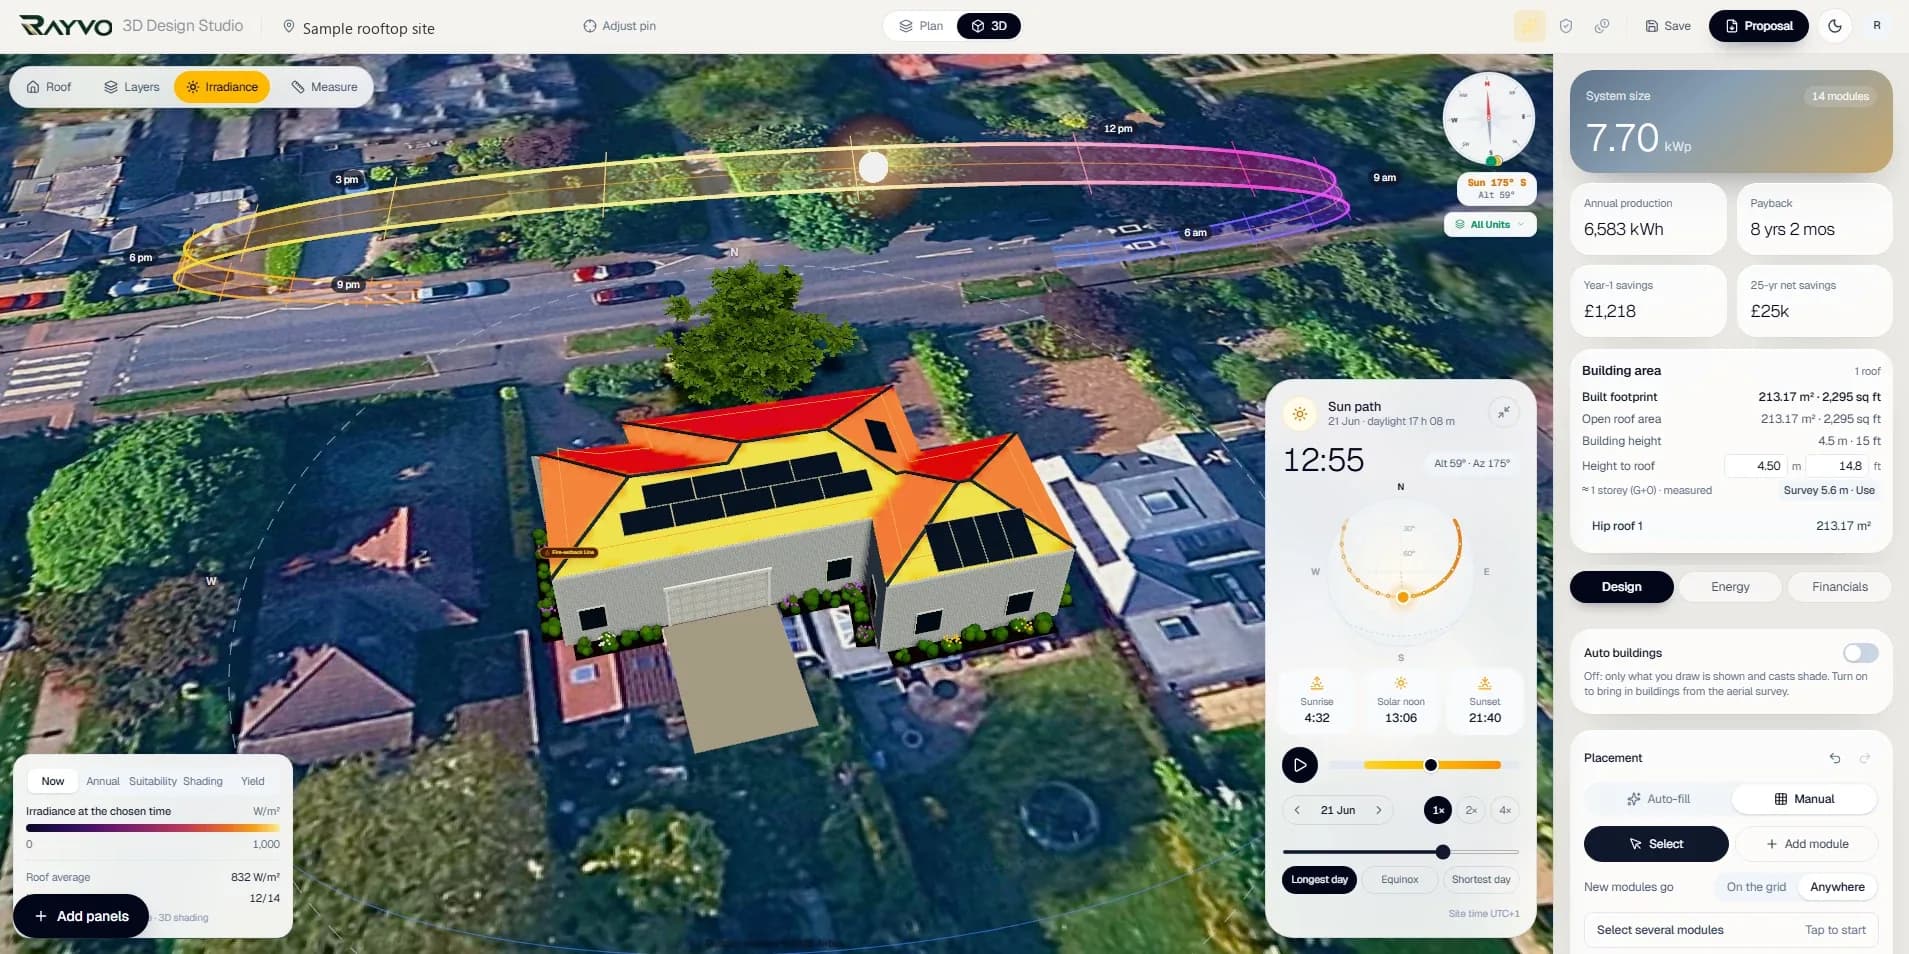
- A time scrubber moves the sun through the day; shortcuts jump to the longest day, the equinox and the shortest day. Shadows in the 3D view follow it.
- What you get
- A live view the customer can watch: where the shadow of the tank falls at 9 am in December.
- Why it matters
- Customers trust a layout they can see the sun move across.
Every obstruction on Indian roofs
- What it does
- Models the objects that actually shade rooftops.
- How it works
- Overhead and Sintex water tanks, stair rooms (mumty), parapet walls with their height, AC units, solar water heaters, dishes, vents, skylights, upper storeys, hand-drawn trees and neighbouring buildings, each with its own height.
- What you get
- Keep-out areas for the layout and real shadows in the analysis.
- Why it matters
- On a typical RCC terrace the tank and stair room decide where the last strings can go.
Shading in the proposal
- What it does
- Carries the analysis into what the customer reads.
- How it works
- The proposal shows annual production after shading, shading loss and solar access, and the layout by roof face with yearly energy.
- What you get
- A proposal page with the shading figures printed beside the layout.
- Why it matters
- A customer comparing quotations can see why one layout produces more than another.
What the outputs look like
Screens from the RAYVO 3D Design Studio, pages from its proposals, and sample drawings marked as illustrations.
Four steps on one design
- 1
Draw the site
Roof, parapet, tanks, stair room, trees and neighbours.
- 2
Read the heat map
Annual, Shading and Yield views show the strong areas.
- 3
Place the tables
Keep clear of the shadows the heat map shows.
- 4
Check the loss
Shading loss per table and per month, before quoting.
The methods behind the numbers
Design-stage figures from recognised methods. Final structural and electrical designs are signed by licensed engineers.
| Sun sampling | 21st of every month, half-hour steps, site time zone |
|---|---|
| What is ray-cast | Buildings, storeys, parapets, rooftop objects, trees, neighbours and other panel rows |
| Transposition | Hay-Davies: beam, circumsolar and isotropic diffuse, ground reflection (albedo 0.2) |
| Climate data | PVGIS monthly global and diffuse horizontal irradiation |
| Diffuse handling | Monthly beam share from the site's diffuse fraction (0.7 when the record is unavailable) |
| Outputs | Shading factor per table and per month, solar access, five heat map modes |
Solar Shadow Analysis questions
A single time shows one shadow. RAYVO samples the whole year (the 21st of every month, every half hour) and adds up the energy lost, so a shadow that only matters in winter mornings is counted for exactly what it costs.
Yes. Shade only blocks direct sunlight, so each month's loss is scaled by that month's direct share from the site's climate record. Cloudy months lose less to shade than clear ones.
Yes. Overhead and Sintex tanks, stair rooms, parapets, AC units, solar water heaters and more are first-class objects with their own heights, and they cast shadows in the analysis.
No. Trees are drawn by hand where they actually are, with their height and canopy, so the analysis only includes trees that exist.
More solar engineering in RAYVO
Ready to run your business smarter?
Bring your solar design, CRM, quotations, projects, finance and business operations together with RAYVO.
Or talk to us on WhatsApp at +91 90399 94090